
Washington Commanders vs Atlanta Falcons Match Player Stats is the main focus of this complete NFL game breakdown following Atlanta’s 34–27 victory at Mercedes-Benz Stadium. The game featured strong quarterback performances, explosive offensive plays, and crucial fourth-quarter moments that ultimately decided the outcome between these two competitive teams.
In this Washington Commanders vs Atlanta Falcons Match Player Stats analysis, we cover full game details including scoring summary, game leaders, rushing and receiving stats, defensive performances, and advanced insights. Atlanta controlled key moments with efficient execution, while Washington remained competitive despite missing several key players, making this matchup one of the most interesting contests of the week.
According to ESPN Box Score, Atlanta dominated key statistical categories.
Match Overview
The game began with Atlanta asserting early control, scoring 10 unanswered points in the first quarter. Their offensive rhythm was sharp, and their defense limited Washington’s early opportunities.
However, Washington responded in the second quarter, gradually closing the gap. Despite missing key starters, they demonstrated resilience and adaptability, ensuring the game remained competitive heading into halftime.
Game Information
| Category | Details |
|---|---|
| Date & Time | 10:00 AM, September 28, 2025 |
| Stadium | Mercedes-Benz Stadium |
| Location | Atlanta, GA |
| Attendance | 71,492 |
| Broadcast | CBS |
Officiating Crew
| Role | Official |
|---|---|
| Referee | Scott Novak |
| Umpire | Duane Heydt |
| Down Judge | Brian Sakowski |
| Line Judge | Mark Stewart |
| Field Judge | Terry Brown |
| Side Judge | Don Willard |
| Back Judge | Tony Josselyn |
Final Score Summary
| Team | Q1 | Q2 | Q3 | Q4 | Final |
|---|---|---|---|---|---|
| Washington Commanders | 0 | 10 | 6 | 11 | 27 |
| Atlanta Falcons | 10 | 7 | 14 | 3 | 34 |
Game Leaders
| Category | Washington (WSH) | Atlanta (ATL) |
|---|---|---|
| Passing Yards | Marcus Mariota – 156 (16/27, 2 TD, 1 INT) | Michael Penix Jr. – 313 (20/26, 2 TD, 1 INT) |
| Rushing Yards | Chris Rodriguez Jr. – 59 (7 CAR) | Bijan Robinson – 75 (17 CAR, 1 TD) |
| Receiving Yards | Deebo Samuel – 72 (6 REC, 1 TD) | Drake London – 110 (8 REC, 1 TD) |
| Sacks | Frankie Luvu – 1 | Zach Harrison – 1 |
| Tackles | Bobby Wagner – 10 | Jessie Bates III – 7 |
Scoring Summary
| Quarter | Time | Team | Play | Score |
|---|---|---|---|---|
| Q1 | 10:46 | ATL | FG | 3–0 |
| Q1 | 0:49 | ATL | TD pass | 10–0 |
| Q2 | 11:31 | WAS | TD pass | 10–7 |
| Q2 | 8:27 | ATL | TD run | 17–7 |
| Q2 | 5:24 | WAS | FG | 17–10 |
| Q3 | 10:12 | WAS | FG | 17–13 |
| Q3 | 9:25 | ATL | TD pass | 24–13 |
| Q3 | 4:22 | WAS | FG | 24–16 |
| Q3 | 0:14 | ATL | TD run | 31–16 |
| Q4 | 8:48 | WAS | TD + 2PT | 31–24 |
| Q4 | 1:57 | ATL | FG | 34–24 |
| Q4 | 1:29 | WAS | FG | 34–27 |
Rushing Statistics Breakdown
Atlanta Falcons showcased a balanced rushing attack, led by Bijan Robinson, who contributed effectively both in yardage and scoring. Meanwhile, Tyler Allgeier provided strong support, ensuring consistency in ground plays.
Washington, on the other hand, relied on explosive runs rather than volume. Chris Rodriguez Jr. delivered the most impactful rushing performance for his team with an impressive average per carry.
| Player | Team | CAR | YDS | AVG | TD | LONG |
|---|---|---|---|---|---|---|
| Bijan Robinson | ATL | 17 | 75 | 4.4 | 1 | 14 |
| Tyler Allgeier | ATL | 16 | 51 | 3.2 | 1 | 19 |
| Michael Penix Jr. | ATL | 4 | 2 | 0.5 | 0 | 5 |
| ATL Total | ATL | 37 | 128 | 3.5 | 2 | 19 |
| Chris Rodriguez Jr. | WAS | 7 | 59 | 8.4 | 0 | 48 |
| Jacory Croskey-Merritt | WAS | 7 | 47 | 6.7 | 0 | 16 |
| Marcus Mariota | WAS | 2 | 20 | 10.0 | 0 | 22 |
| Deebo Samuel | WAS | 3 | 9 | 3.0 | 0 | 7 |
| Chris Moore | WAS | 1 | 9 | 9.0 | 0 | 9 |
| Jeremy McNichols | WAS | 2 | 3 | 1.5 | 0 | 2 |
| WAS Total | WAS | 22 | 147 | 6.7 | 0 | 48 |
Receiving Statistics Breakdown
The Falcons dominated the air game with standout performances from Drake London and Bijan Robinson, who contributed heavily in receiving yards. Tight end Kyle Pitts also played a crucial role in converting key plays.
Washington’s receiving unit was led by Deebo Samuel, who delivered a consistent and efficient performance despite limited offensive support.
| Player | Team | REC | TGT | YDS | AVG | TD | LONG |
|---|---|---|---|---|---|---|---|
| Drake London | ATL | 8 | 10 | 110 | 13.8 | 1 | 43 |
| Bijan Robinson | ATL | 4 | 5 | 106 | 26.5 | 0 | 69 |
| Kyle Pitts | ATL | 5 | 5 | 70 | 14.0 | 1 | 26 |
| Casey Washington | ATL | 1 | 3 | 19 | 19.0 | 0 | 19 |
| Darnell Mooney | ATL | 1 | 1 | 15 | 15.0 | 0 | 15 |
| Ray-Ray McCloud III | ATL | 1 | 2 | -7 | -7.0 | 0 | — |
| ATL Total | ATL | 20 | 26 | 313 | 15.7 | 2 | 69 |
| Deebo Samuel | WAS | 6 | 6 | 72 | 12.0 | 1 | 24 |
| Luke McCaffrey | WAS | 2 | 3 | 21 | 10.5 | 1 | 16 |
| Zach Ertz | WAS | 2 | 4 | 21 | 10.5 | 0 | 14 |
| Jaylin Lane | WAS | 2 | 3 | 18 | 9.0 | 0 | 11 |
| Tay Martin | WAS | 1 | 1 | 14 | 14.0 | 0 | 14 |
| Jacory Croskey-Merritt | WAS | 2 | 2 | 10 | 5.0 | 0 | 6 |
| Jeremy McNichols | WAS | 1 | 2 | 0 | 0.0 | 0 | — |
| Chris Moore | WAS | 0 | 3 | 0 | — | 0 | — |
| WAS Total | WAS | 16 | 24 | 156 | 9.8 | 2 | 24 |
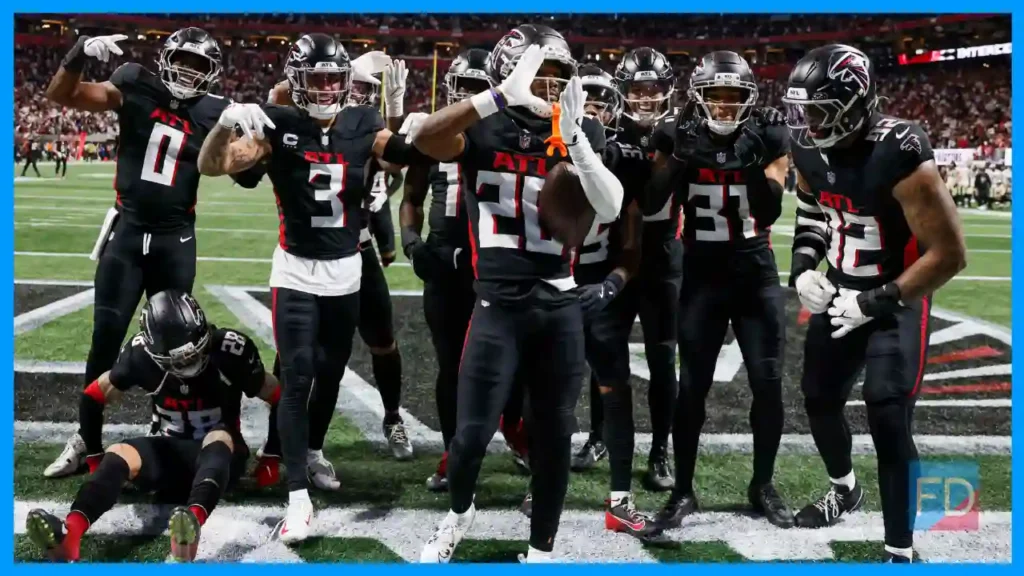
Defensive Performance Analysis
Defensively, both teams delivered impactful plays, with Washington showing strong tackling depth led by Bobby Wagner. Frankie Luvu contributed with a sack, while Mike Sainristil added an interception.
Atlanta’s defense also stepped up, particularly with Xavier Watts recording a key interception and Zach Harrison applying pressure with a sack.
| Player | Team | TOT | SOLO | SACKS | TFL | PD | INT |
|---|---|---|---|---|---|---|---|
| Bobby Wagner | WAS | 10 | 4 | 0 | 1 | 0 | 0 |
| Frankie Luvu | WAS | 8 | 5 | 1.0 | 1 | 0 | 0 |
| Jeremy Reaves | WAS | 8 | 4 | 0 | 0 | 0 | 0 |
| Mike Sainristil | WAS | 7 | 3 | 0 | 0 | 1 | 1 |
| Marshon Lattimore | WAS | 6 | 4 | 0 | 1 | 0 | 0 |
| Jessie Bates III | ATL | 7 | 4 | 0 | 0 | 0 | 0 |
| Xavier Watts | ATL | 6 | 2 | 0 | 0 | 1 | 1 |
| Kaden Elliss | ATL | 5 | 3 | 0.5 | 1 | 0 | 0 |
| Leonard Floyd | ATL | 4 | 1 | 0.5 | 1 | 0 | 0 |
| Zach Harrison | ATL | 1 | 1 | 1.0 | 1 | 0 | 0 |
Special Teams Performance
Kicking
| Player | Team | FG | PCT | LONG | XP | PTS |
|---|---|---|---|---|---|---|
| Matt Gay | WAS | 4/4 | 100% | 52 | 1/1 | 13 |
| John Parker Romo | ATL | 2/2 | 100% | 38 | 4/4 | 10 |
Punting
| Player | Team | PUNTS | YDS | AVG | LONG |
|---|---|---|---|---|---|
| Tress Way | WAS | 2 | 89 | 44.5 | 47 |
| Bradley Pinion | ATL | 2 | 92 | 46.0 | 48 |
Kick Returns
| Player | Team | RET | YDS | AVG | LONG | TD |
|---|---|---|---|---|---|---|
| Luke McCaffrey | WAS | 6 | 199 | 33.2 | 58 | 0 |
| Jamal Agnew | ATL | 3 | 69 | 23.0 | 28 | 0 |
| Ray-Ray McCloud III | ATL | 2 | 59 | 29.5 | 30 | 0 |
Punt Returns
| Player | Team | RET | YDS | AVG | LONG | TD |
|---|---|---|---|---|---|---|
| Jaylin Lane | WAS | 2 | 0 | 0.0 | — | 0 |
| Mike Ford | ATL | 1 | 0 | 0.0 | — | 0 |
Game Analysis
Atlanta’s offensive efficiency stood out as the defining factor. Their ability to execute plays on third down allowed them to extend drives and control possession. Additionally, their balanced attack between passing and rushing kept Washington’s defense under constant pressure.
Conversely, Washington relied heavily on situational success rather than sustained drives. While they produced key plays at important moments, their inability to consistently convert third downs limited their overall effectiveness.
Key Turning Point
The most critical moment occurred in the fourth quarter when Atlanta orchestrated a long, clock-consuming drive. This sequence not only resulted in points but also drained valuable time from the clock.
This drive effectively reduced Washington’s chances of completing a comeback, making it the defining turning point of the game.
Momentum Shift Analysis
Washington regained momentum midway through the fourth quarter after scoring a touchdown and converting a two-point attempt. At that stage, the game appeared to be shifting in their favor.
However, Atlanta quickly regained control with a composed offensive response. Their ability to stabilize the game and respond immediately prevented Washington from capitalizing on that momentum shift.
Clutch Moments
Atlanta’s performance in clutch situations highlighted their composure and experience. Key third-down conversions during the final drive allowed them to maintain possession and secure the win.
Defensively, they managed to limit Washington’s final attempts, ensuring that the comeback effort fell short in the closing minutes.
Advanced Game Analysis
For more detailed NFL match breakdowns, check out our latest analysis:
- New England Patriots vs Tennessee Titans Match Player Stats
- Seattle Seahawks vs Carolina Panthers Match Player Stats
From a statistical perspective, Atlanta dominated several key areas. They recorded significantly higher total yardage and maintained superior efficiency in passing plays.
Additionally, their 50% third-down conversion rate compared to Washington’s 13% clearly illustrates the difference in execution. Time of possession also favored Atlanta, allowing them to control the pace of the game.
Quarterback Performance Analysis
Atlanta Falcons QB
| Player | CMP | ATT | YDS | TD | INT |
|---|---|---|---|---|---|
| Michael Penix Jr. | 20 | 26 | 313 | 2 | 1 |
Michael Penix Jr. delivered an outstanding performance, showcasing accuracy, decision-making, and leadership.
Washington Commanders QB
| Player | CMP | ATT | YDS | TD | INT |
|---|---|---|---|---|---|
| Marcus Mariota | 16 | 27 | 156 | 2 | 1 |
Marcus Mariota stepped in effectively and kept Washington competitive despite challenging circumstances.
Team Statistics
| Stat | Washington | Atlanta |
|---|---|---|
| Total Yards | 294 | 435 |
| Passing Yards | 147 | 307 |
| Rushing Yards | 147 | 128 |
| First Downs | 17 | 24 |
| 3rd Down % | 13% | 50% |
| Time of Possession | 25:45 | 34:15 |
Inactive Players
Washington Commanders: Jayden Daniels, Terry McLaurin, Noah Brown, John Bates
Atlanta Falcons: None
Why Atlanta Falcons Won
- Dominated third-down efficiency: Atlanta converted 50% of their third-down attempts, which allowed them to extend drives consistently and keep Washington’s defense on the field for longer periods. This control played a major role in maintaining momentum throughout the game.
- Balanced offensive strategy: The Falcons executed a well-rounded attack, combining effective passing from their quarterback with a reliable rushing game. This balance made it difficult for Washington’s defense to predict plays or apply consistent pressure.
- Better time management: Atlanta controlled the clock with long, structured drives, especially in the second half. Their ability to manage possession limited Washington’s offensive opportunities and reduced comeback chances.
- Strong fourth-quarter execution: In the final quarter, Atlanta remained composed and executed key plays, including a crucial scoring drive that consumed significant time and extended their lead when it mattered most.
- Capitalized on key moments: Whenever opportunities arose, Atlanta converted them into points. Their efficiency in red-zone situations and ability to respond after Washington scores made the difference in a closely contested game.
What Went Wrong for Washington Commanders
- Low third-down conversion rate: Washington struggled significantly on third downs, converting only a small percentage of attempts. This limited their ability to sustain drives and build offensive rhythm.
- Missing key players: The absence of important starters, particularly on offense, affected their overall performance. It reduced their explosiveness and forced them to rely on backup options in critical situations.
- Inconsistent offensive drives: While Washington produced some big plays, they lacked consistency across drives. This inconsistency prevented them from maintaining pressure on Atlanta’s defense.
- Defensive lapses in crucial moments: At key points in the game, especially in the fourth quarter, Washington’s defense allowed Atlanta to convert important plays, including third-down situations that extended scoring drives.
Injuries
Washington Commanders: Multiple key players missed the game due to knee and quad injuries, significantly impacting offensive depth and overall execution
Atlanta Falcons: No major injuries reported during the game
Key Takeaways
- Atlanta maintained control through efficient offensive execution and strong situational play, particularly on third downs
- Washington remained competitive despite missing key players, showing resilience and determination throughout the game
- Third-down efficiency proved to be the biggest difference between the two teams
- Atlanta’s ability to perform under pressure in clutch moments ultimately secured the victory
Related Articles
- Miami Dolphins vs Denver Broncos Match Player Stats
- Baltimore Ravens vs Green Bay Packers Match Player Stats
Conclusion
The Washington Commanders vs Atlanta Falcons Match Player Stats clearly highlight how Atlanta secured a 34–27 victory through better execution, strong third-down efficiency, and effective game management in crucial moments. Their balanced offensive approach and ability to deliver under pressure ultimately made the difference in a closely contested matchup.
At the same time, the Washington Commanders vs Atlanta Falcons Match Player Stats also show that Washington remained highly competitive despite missing key players. Their resilience and late-game effort kept the game within reach, but Atlanta’s consistency and control in critical situations ensured they closed out the win successfully.
FAQs
What was the final score?
Atlanta Falcons won 34–27.
Who had the most passing yards?
Michael Penix Jr. with 313 yards.
What was the key turning point?
Atlanta’s long fourth-quarter drive.
Why did Washington lose?
Poor third-down efficiency and missing key players.
Which team performed better statistically?
Atlanta led in total yards, passing efficiency, and possession.
VISIT MORE: FD SPORTIE