


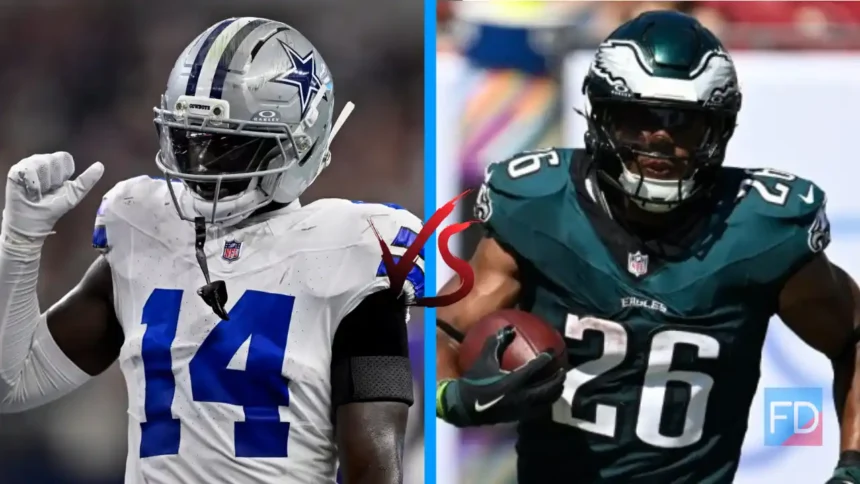
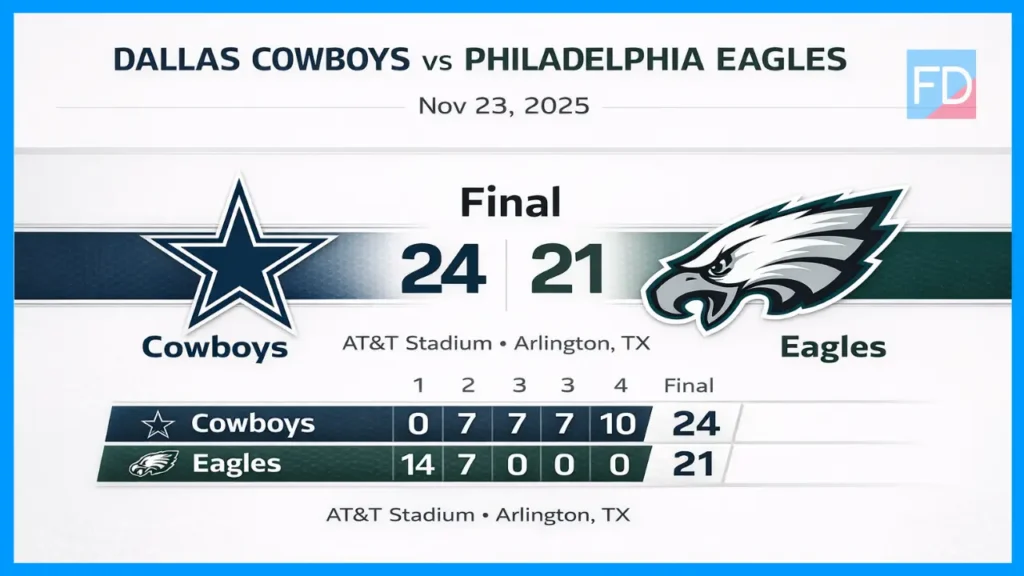
Dallas Cowboys vs Philadelphia Eagles Match Player Stats showcases one of the most dramatic NFL clashes of the 2025 season. The Dallas Cowboys completed a strong comeback to defeat the Philadelphia Eagles 24–21 at AT&T Stadium, despite trailing early in the game.
In this Dallas Cowboys vs Philadelphia Eagles Match Player Stats breakdown, the Eagles dominated the first half, but the Cowboys adjusted in the second half with explosive offense, better execution, and clutch plays that ultimately flipped the result.
For full game details and stats, check: Latest NFL Match Player Stats View Full Match Stats on ESPN
Match Overview
This Dallas Cowboys vs Philadelphia Eagles Match Player Stats matchup began with Philadelphia in full control. The Eagles scored 21 points in the first half and looked dominant behind Jalen Hurts’ dual-threat performance. However, Dallas showed resilience and responded with a balanced offensive approach led by Dak Prescott.
The second half completely shifted the momentum. Dallas scored 17 unanswered points across the third and fourth quarters, capitalizing on defensive stops and offensive consistency. While Philadelphia struggled to maintain rhythm after halftime, the Cowboys executed better in critical moments to secure the win.


Game Information
| Category | Details |
|---|---|
| Date | November 23, 2025 |
| Time | 1:25 PM |
| Stadium | AT&T Stadium |
| Location | Arlington, TX |
| Attendance | 93,068 |
| Broadcast | FOX |
Officiating Crew
| Role | Official |
|---|---|
| Referee | Bill Vinovich |
| Umpire | Scott Walker |
| Down Judge | Dale Keller |
| Line Judge | Tripp Sutter |
| Field Judge | Aaron Santi |
| Side Judge | Jimmy Buchanan |
| Back Judge | Todd Prukop |
Final Score Summary
Game Leaders
| Category | Eagles | Cowboys |
|---|---|---|
| Passing | Jalen Hurts — 289 | Dak Prescott — 354 |
| Rushing | Jalen Hurts — 33 (2 TD) | Javonte Williams — 87 |
| Receiving | A.J. Brown — 110 | George Pickens — 146 |
| Sacks | Nakobe Dean — 1 | Osa Odighizuwa — 1 |
| Tackles | Zack Baun — 9 | Reddy Steward — 6 |
Scoring Summary
| Quarter | Team | Play | Score |
|---|---|---|---|
| Q1 | PHI | Hurts TD run | PHI 7–0 |
| Q1 | PHI | Hurts TD run | PHI 14–0 |
| Q2 | DAL | TD drive | PHI 14–7 |
| Q2 | PHI | Passing TD | PHI 21–7 |
| Q3 | DAL | TD drive | PHI 21–14 |
| Q4 | DAL | FG | PHI 21–17 |
| Q4 | DAL | Game-winning TD | DAL 24–21 |
Rushing Statistics Breakdown
| Player | Team | CAR | YDS | AVG | TD |
|---|---|---|---|---|---|
| Jalen Hurts | PHI | 7 | 33 | 4.7 | 2 |
| Saquon Barkley | PHI | 10 | 22 | 2.2 | 0 |
| Tank Bigsby | PHI | 1 | 8 | 8.0 | 0 |
| PHI Total | 18 | 63 | 3.5 | 2 | |
| Javonte Williams | DAL | 20 | 87 | 4.4 | 0 |
| Malik Davis | DAL | 3 | 24 | 8.0 | 0 |
| Dak Prescott | DAL | 5 | 9 | 1.8 | 1 |
| DAL Total | 31 | 125 | 4.0 | 1 |
Receiving Statistics Breakdown
| Player | Team | REC | YDS | AVG | TD |
|---|---|---|---|---|---|
| A.J. Brown | PHI | 8 | 110 | 13.8 | 1 |
| DeVonta Smith | PHI | 6 | 89 | 14.8 | 0 |
| Saquon Barkley | PHI | 7 | 52 | 7.4 | 0 |
| PHI Total | 27 | 289 | 10.7 | 1 | |
| George Pickens | DAL | 9 | 146 | 16.2 | 1 |
| CeeDee Lamb | DAL | 4 | 75 | 18.8 | 0 |
| Jake Ferguson | DAL | 5 | 60 | 12.0 | 0 |
| DAL Total | 23 | 354 | 15.4 | 2 |
Philadelphia Eagles Defense
| Player | TOT | SOLO | SACKS | TFL | PD | QB HITS |
|---|---|---|---|---|---|---|
| Zack Baun | 9 | 3 | 0 | 0 | 1 | 0 |
| Reed Blankenship | 8 | 3 | 0 | 0 | 1 | 0 |
| Cooper DeJean | 7 | 5 | 0 | 0 | 1 | 0 |
| Jordan Davis | 6 | 1 | 0 | 1 | 0 | 0 |
| Jalen Carter | 5 | 4 | 0 | 0 | 0 | 1 |
| Sydney Brown | 5 | 3 | 0 | 0 | 0 | 0 |
| Nakobe Dean | 5 | 2 | 1 | 1 | 0 | 1 |
| Jalyx Hunt | 4 | 2 | 0 | 0 | 0 | 1 |
| Adoree’ Jackson | 3 | 3 | 0 | 0 | 0 | 0 |
| Andrew Mukuba | 3 | 2 | 0 | 0 | 0 | 0 |
| Quinyon Mitchell | 3 | 2 | 0 | 0 | 1 | 0 |
| Nolan Smith Jr. | 3 | 1 | 0 | 0 | 0 | 2 |
| Smael Mondon Jr. | 2 | 1 | 0 | 0 | 0 | 0 |
| Jeremiah Trotter Jr. | 2 | 1 | 0 | 0 | 0 | 0 |
| Michael Carter II | 1 | 1 | 0 | 0 | 0 | 0 |
| Moro Ojomo | 1 | 1 | 0 | 0 | 0 | 0 |
| Jihaad Campbell | 1 | 1 | 0 | 0 | 0 | 0 |
| Kelee Ringo | 1 | 0 | 0 | 0 | 0 | 0 |
| Will Shipley | 1 | 0 | 0 | 0 | 0 | 0 |
| Jaelan Phillips | 0 | 0 | 0 | 0 | 0 | 1 |
Dallas Cowboys Defense
| Player | TOT | SOLO | SACKS | TFL | PD | QB HITS |
|---|---|---|---|---|---|---|
| Reddy Steward | 6 | 3 | 0 | 0 | 0 | 0 |
| Donovan Wilson | 5 | 5 | 0 | 0 | 1 | 0 |
| DeMarvion Overshown | 5 | 4 | 0 | 0 | 0 | 0 |
| Malik Hooker | 5 | 1 | 0 | 0 | 0 | 0 |
| Caelen Carson | 4 | 4 | 0 | 0 | 0 | 0 |
| Osa Odighizuwa | 4 | 2 | 1 | 1 | 0 | 4 |
| DaRon Bland | 3 | 2 | 0 | 0 | 1 | 0 |
| Kenneth Murray Jr. | 3 | 1 | 0 | 0 | 0 | 0 |
| Hunter Luepke | 3 | 1 | 0 | 0 | 0 | 0 |
| Donovan Ezeiruaku | 3 | 1 | 0 | 0 | 0 | 0 |
| Jadeveon Clowney | 2 | 2 | 0 | 0 | 0 | 0 |
| Logan Wilson | 2 | 2 | 0 | 0 | 0 | 0 |
| Shemar James | 2 | 2 | 0 | 0 | 0 | 0 |
| Shavon Revel Jr. | 2 | 2 | 0 | 0 | 0 | 0 |
| C.J. Goodwin | 2 | 0 | 0 | 0 | 0 | 0 |
| Solomon Thomas | 2 | 0 | 0 | 0 | 0 | 0 |
| Kenny Clark | 1 | 1 | 0 | 0 | 0 | 0 |
| Quinnen Williams | 1 | 1 | 0 | 1 | 0 | 1 |
| Sam Williams | 1 | 1 | 0 | 0 | 0 | 0 |
| Markquese Bell | 1 | 0 | 0 | 0 | 0 | 0 |
| Brevyn Spann-Ford | 1 | 0 | 0 | 0 | 0 | 0 |
| Alijah Clark | 1 | 0 | 0 | 0 | 0 | 0 |
| Dante Fowler Jr. | 0 | 0 | 0 | 0 | 1 | 0 |
| James Houston | 0 | 0 | 0 | 0 | 0 | 1 |
Special Teams Performance
Kicking
| Player | Team | FG | XP |
|---|---|---|---|
| Jake Elliott | PHI | 0/1 | 3/3 |
| Brandon Aubrey | DAL | 1/2 | 3/3 |
Punting
| Player | Team | AVG |
|---|---|---|
| Braden Mann | PHI | 50.0 |
| Bryan Anger | DAL | 56.0 |
Returns
| Team | Kick Return Yards |
|---|---|
| Eagles | 106 |
| Cowboys | 85 |
Game Analysis
Dallas Cowboys vs Philadelphia Eagles Match Player Stats clearly show that this game was defined by second-half dominance from Dallas. While the Eagles controlled the first half with a 21–7 lead, the Cowboys made key adjustments that completely changed the game’s direction.
Dallas improved defensive pressure, limited big passing plays, and controlled offensive tempo in the second half. Even though both teams had 2 turnovers each, the Cowboys used their 473 total yards more effectively, especially in high-pressure moments. Their ability to execute when it mattered most proved to be the deciding factor.
Detailed stats available here: ESPN Match AnalysisKey Turning Point
The biggest turning point came in the third quarter when Dallas began its comeback with a crucial scoring drive.
This moment shifted the game from Eagles control to Cowboys momentum. After cutting the lead, Dallas defense stepped up and forced Philadelphia into stalled drives, allowing the offense to stay aggressive and confident.
Momentum Shift Analysis
The Cowboys scored 17 unanswered points, turning a 21–7 deficit into a 24–21 victory.
During this stretch:
- Dallas offense became more aggressive
- Eagles offense lost rhythm
- Defensive stops increased
Philadelphia failed to score in the entire second half, which highlights how dramatically momentum shifted in favor of Dallas.
Clutch Moments
The most critical moment came in the fourth quarter when Dallas executed a game-winning touchdown drive.
Key clutch factors:
- Dak Prescott delivered under pressure
- Offensive line held strong in key plays
- Defense closed the game with stops
These moments showed why Dallas controlled the final outcome despite trailing earlier.
Advanced Game Analysis
Key Metrics
| Metric | Eagles | Cowboys |
|---|---|---|
| Total Yards | 339 | 473 |
| Turnovers | 2 | 2 |
| Red Zone | 3/3 | 3/5 |
| Possession | 30:58 | 29:02 |
Detailed Analysis
From an advanced perspective, Dallas Cowboys vs Philadelphia Eagles Match Player Stats highlight a clear contrast between efficiency and dominance.
The Eagles were perfect in the red zone (3/3), which helped them build an early lead. However, Dallas dominated total yardage and explosive plays, gaining 473 yards compared to 339. This yardage gap allowed the Cowboys to control the game flow in the second half.
Additionally, even though possession time was nearly equal, Dallas used its drives more aggressively and effectively. The Eagles lacked second-half adjustments, which ultimately cost them the game.
Quarterback Performance Analysis
QB Comparison
| QB | YDS | TD | INT |
|---|---|---|---|
| Jalen Hurts | 289 | 1 | 0 |
| Dak Prescott | 354 | 2 | 1 |
QB Performance Breakdown
Jalen Hurts delivered a strong first-half performance, completing efficient passes and contributing to early scoring drives. However, his impact dropped significantly in the second half, where the Eagles offense failed to produce points.
Dak Prescott, on the other hand, showed resilience and leadership. Despite throwing one interception, he finished with 354 passing yards and 2 touchdowns, making key plays during the comeback. His aggressive and confident play style in the second half was a major reason Dallas secured the win.
Full Team Stats
| Category | Philadelphia Eagles | Dallas Cowboys |
|---|---|---|
| 1st Downs | 19 | 25 |
| Passing 1st Downs | 14 | 16 |
| Rushing 1st Downs | 4 | 6 |
| 1st Downs (Penalties) | 1 | 3 |
| 3rd Down Efficiency | 5/12 | 5/12 |
| 4th Down Efficiency | 0/0 | 0/2 |
| Total Plays | 58 | 68 |
| Total Yards | 339 | 473 |
| Total Drives | 11 | 12 |
| Yards per Play | 5.8 | 7.0 |
| Passing Yards | 276 | 348 |
| Comp/Att | 27/39 | 23/36 |
| Yards per Pass | 6.9 | 9.4 |
| Interceptions Thrown | 0 | 1 |
| Sacks-Yards Lost | 1-13 | 1-6 |
| Rushing Yards | 63 | 125 |
| Rushing Attempts | 18 | 31 |
| Yards per Rush | 3.5 | 4.0 |
| Red Zone (Made-Att) | 3/3 | 3/5 |
| Penalties | 14-96 | 8-69 |
| Turnovers | 2 | 2 |
| Fumbles Lost | 2 | 1 |
| Defensive / ST TDs | 0 | 0 |
| Possession | 30:58 | 29:02 |
Team Stats Analysis
Dallas Cowboys vs Philadelphia Eagles Match Player Stats clearly highlight that Dallas dominated most major statistical categories despite trailing early in the game.
The Cowboys finished with 473 total yards compared to 339 by the Eagles, showing a massive offensive advantage. They also ran 10 more plays (68 vs 58), which helped them control the pace and create more scoring opportunities. Additionally, Dallas averaged 7.0 yards per play, significantly higher than Philadelphia’s 5.8.
On the other hand, the Eagles were more efficient in scoring situations, converting 100% of their red-zone opportunities (3/3). However, their lack of production in the second half and inability to maintain drives limited their overall impact.
Another key factor was discipline. Philadelphia committed 14 penalties for 96 yards, which hurt their momentum, while Dallas stayed relatively cleaner with 8 penalties for 69 yards.
Even though both teams had 2 turnovers, Dallas used their drives more effectively and capitalized on big plays, especially in the second half.
Team Comparison Insights
| Factor | Advantage |
|---|---|
| Total Yardage | Cowboys |
| Offensive Volume | Cowboys |
| Red Zone Efficiency | Eagles |
| Discipline | Cowboys |
| Second Half Performance | Cowboys |
Why Philadelphia Eagles Lost
- Lost second-half momentum
- Failed to score after halftime
- Defensive breakdowns
- Could not stop Dallas passing attack
What Went Wrong for Dallas Cowboys (Early Game)
- Slow start in first half
- Defensive gaps allowed 21 early points
- Struggled to stop early drives
However, they corrected all issues in the second half.
Injuries
- Eagles:
Adoree’ Jackson was evaluated for a concussion, and Reed Blankenship suffered a thigh injury during the game. - Cowboys:
Tyler Guyton sustained an ankle injury and required evaluation.
Key Takeaways
- Momentum shifts define NFL games
- Second-half adjustments are critical
- Yardage dominance can overcome early deficits
- Clutch performance decides close games
Conclusion
Dallas Cowboys vs Philadelphia Eagles Match Player Stats clearly show that Dallas completed a powerful comeback to win 24–21.
Despite trailing early, the Cowboys dominated the second half with better execution, stronger offense, and clutch decision-making. Philadelphia started strong but failed to adapt, allowing Dallas to take full control and secure the victory.
Explore more NFL breakdowns: Steelers vs Jets Match Player StatsFAQs
Who won the game?
Dallas Cowboys won 24–21.
Who was the top performer?
Dak Prescott with 354 passing yards.
Who led rushing?
Javonte Williams (87 yards).
Key turning point?
Second-half comeback by Dallas.
Total yards difference?
Cowboys had 473 vs Eagles 339.
Why Eagles lost?
Turnovers and second-half collapse.